Reports
Numbers you can decide on.
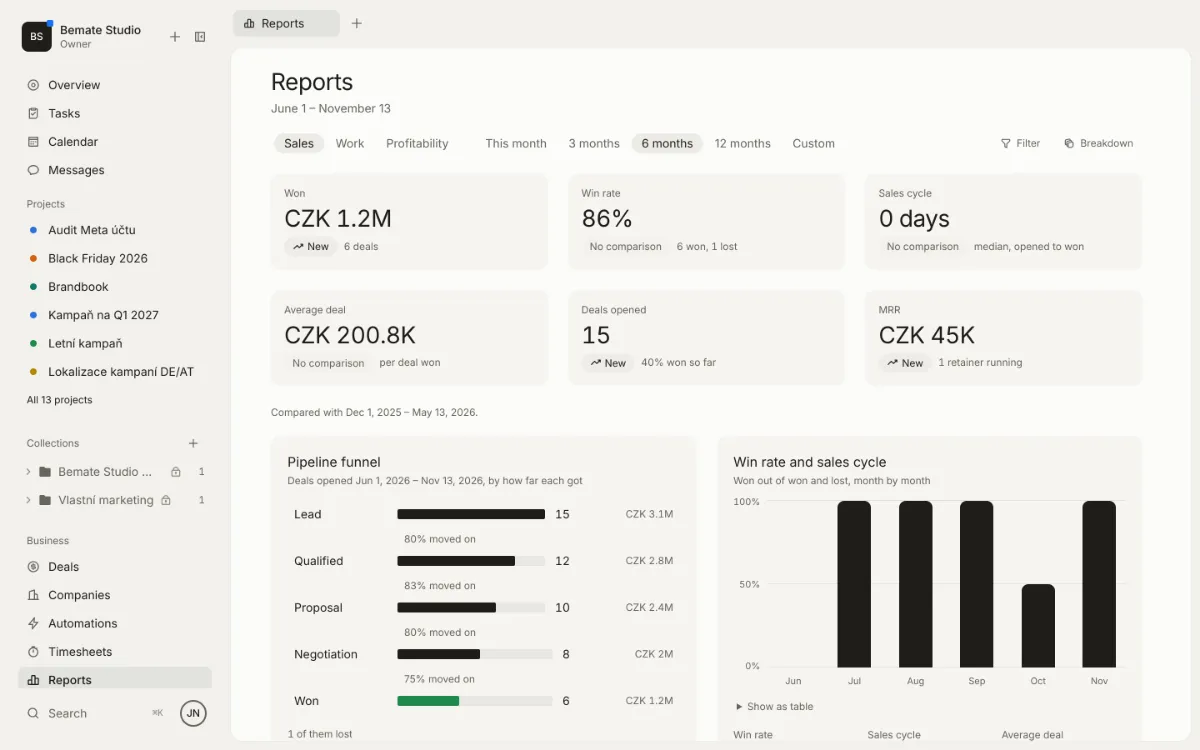
Sales, work and profitability reports for the period you choose, each number with a click through to the deals and tasks behind it. And dashboards from your own databases.
What it does
- 01
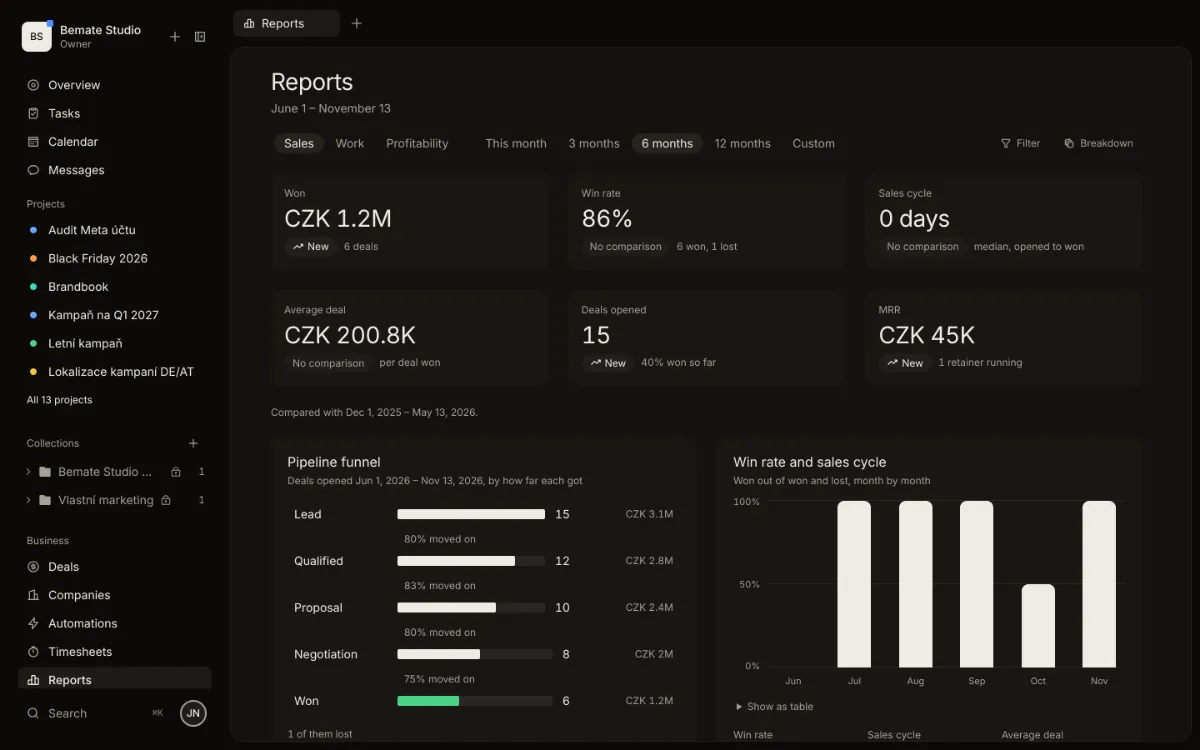
Sales
Won, win rate, sales cycle, average deal and MRR, the pipeline funnel and a comparison with the previous period.
- 02
Work
The team’s throughput, days at zero and the health of spaces. What actually got done, not just closed.
- 03
Profitability
Revenue, cost and margin by client, project and person, with the team’s utilization.
What it looks like
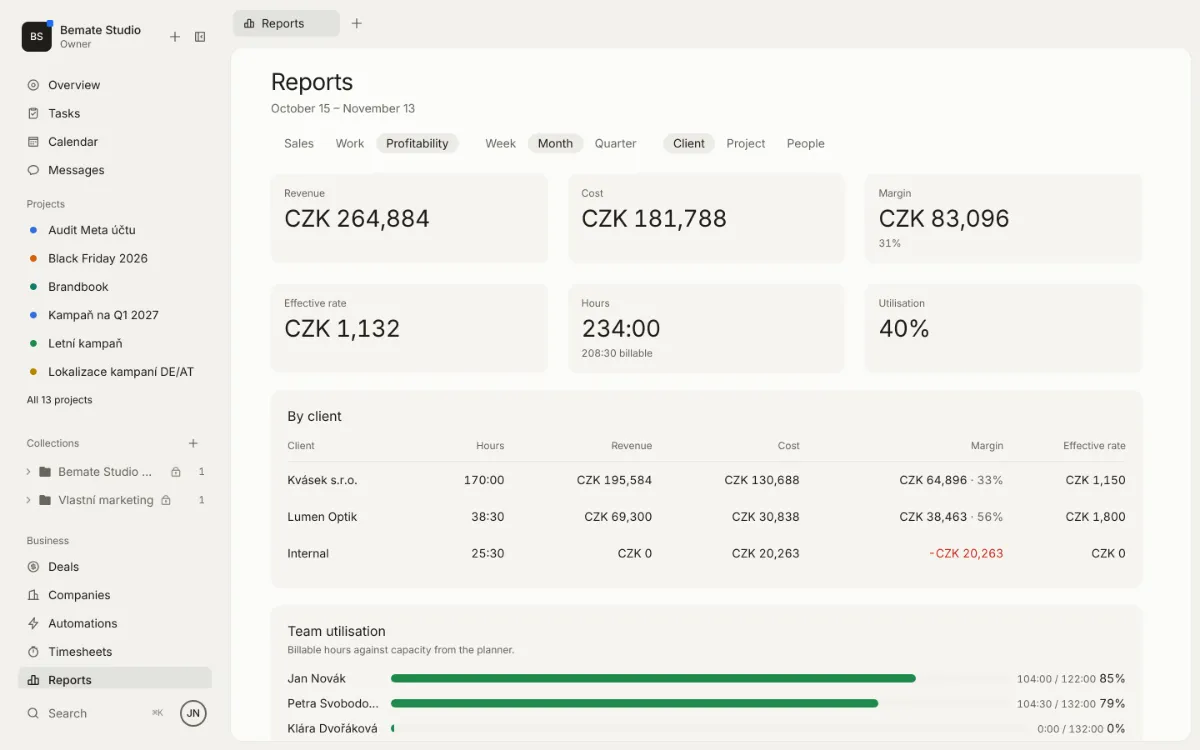
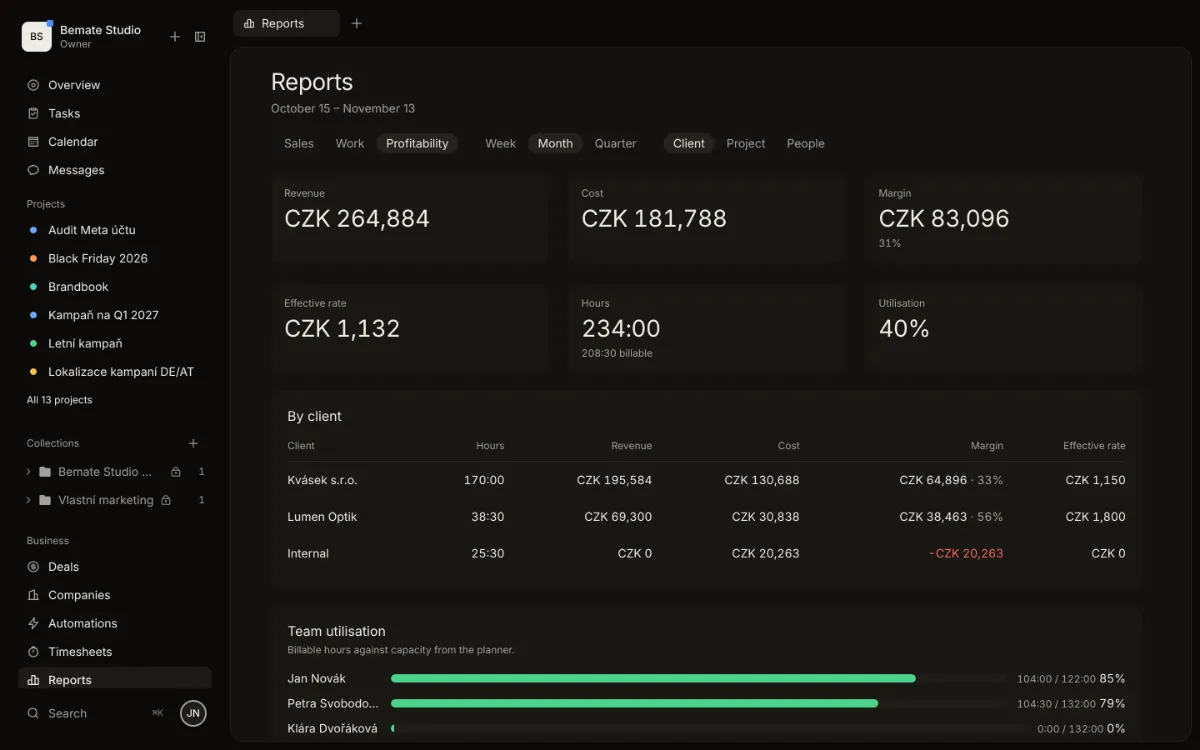
Profitability: revenue, cost and margin by client, and team utilization
In detail
- Sales reports with drill-down
- Throughput and days at zero
- Profitability and utilization
- Charts from databases in docs
- A monthly sales target
- A Monday sales email
Work that ends at zero.
Set up your organization, load companies from ARES, and invite your team and clients when you need them. Clients get access free.